T-SQL Code Coverage in SSDT using the SSDT Dev Pack
Code Coverage
What is code coverage?
When you write some code and then test it, how sure are you that you have tested the whole thing? Code coverage gives you an idea of how well tested a bit of code is.
If you have lots of branches in your code (not something I am advocating) it is important to make sure you test it all so we can use code coverage to get an idea of how much of a particular piece of code has been tested (or not).
How code coverage works with SQL Server (i.e T-SQL) is that because SQL provides a pretty good interface for tracking statements which have been executed (extended events) we can tell which statements have been called. So if we take this example stored procedure:
 create procedure a_procedure(@a_value int)
 as
 begin
if 1=1
begin
select 1
end
if @a_value = 9
begin
end
select a, case when @a_value = 1 then ‘a’ else ‘b’ end from table_name;
end
If we execute this stored procedure we can monitor and show a) how many statements there are in this and also b) which statements have been called but we can’t see which branches of the case statement were actually called. If it was a compiled language like c# where we have a profiler that can alter the assembly etc then we could find out exactly what was called but I personally think knowing which statements are called is way better than having no knowledge of what level of code coverage we have.
How do you use code coverage
I use it as a way to explore what parts of the code have low test coverage as it means that I need to be more careful about making changes in those areas.
I mostly work with legacy applications rather than new ones (my favorite thing is debugging) so often end up looking at big pieces of T-SQL without any tests which have an air of spaghetti code about them (not always just mostly!) so it is a good way to make sure as I write tests, all the diffent things that the code is supposed to be doing.
How do you not use code coverage
Don’t set a requirement that the code must have X % of covered code.
Why
Each piece of code is unique, sometimes you don’t really need to test it and sometimes you need to make sure a statement is called at least 20 different ways - code coverage is a guidance and advice tool not a cut and dry sort of a thing.
How do you measure code coverage in SQL Server?
This brings me neatly to the point of all this - you can either do it manually or you can use my new version of the SSDT Dev Pack (groan):
If you grab it from:
https://visualstudiogallery.msdn.microsoft.com/435e7238-0e64-4667-8980-5…
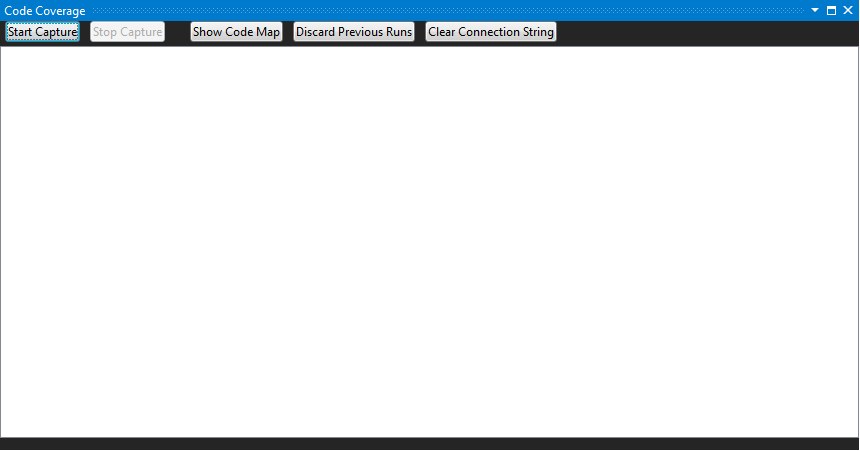
In SSDT if you do Tools->SSDT Dev Pack–>Code Coverage" you end up with this lovely little window:

If you click on “Start Capture” it will ask to connect to SQL Server, go ahead and put in the server details and choose the database you want to monitor.
When you have done that go and run your test code - this could be a manual script, a tSQLt.Run or even you could run your application - just do whatever you want to see how much of you database is covered.
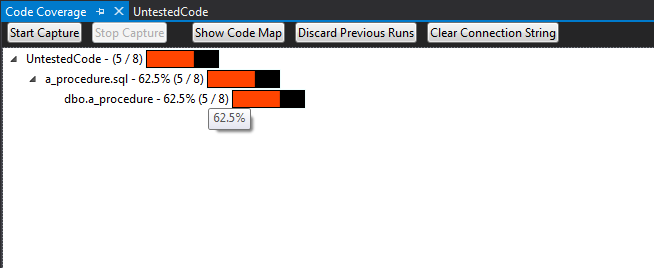
When you have finished then click “Stop Capture” and the dev pack will then enumerate your entire solution for procedures and functions and find out how many statements there are and it will then parse the results of the extended events trace and find which of the statements in the SSDT projects have been covered. You then get this nice little tree view which shows the cumulative amount of code coverage (statements that were executed as part of the test):

In this case we can see that there is one project and one procedure and we have around 62% code coverage (pretty good for a SQL Server project!).
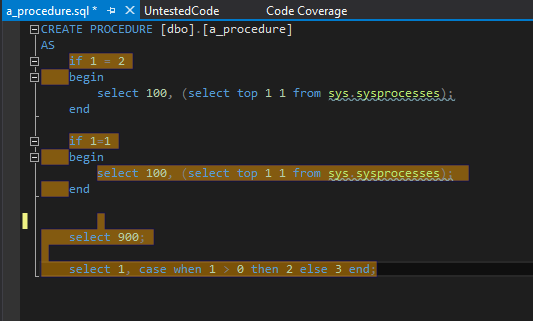
You get ths usual things like double clicking on an item takes you to the document that it exists in but more interestingly we can show the code coverage in the code itself, if you enable “tools->ssdt dev pack–>Display code coverage in Documents” and then click on the procedure in a document window you get:

which is pretty cool if you ask me! What this shows is the statements that have been covered and we can see here that the statement wrapped in the “if 1 = 2” was not called which is lucky (otherwise it would be a pretty poor demo).
Things to note
This uses extended events so you need to have the right permissions to create them (you should probably be using localdb or a local dev instance anyway).
You will need to manually delete the extended events trace files periodically, they are written to the sql log directory and are called CoveCoderage*.xel (and xem on SQL 2008 r2).
If you change the document then I don’t know if the offsets will match up so I stop showing the covered statements until you re-run the trace.
If you need any help with any of this give me a shout :)
Ed
Comments:
Anonymous
February 4, 2016 - 12:15
Coverage Shows - 62.5 % (5/8) here what is 5/8?
Hi , It is good tool. very well done.
couple of questions
1. it is very slow while using code coverage in VSTS
2. Coverage Shows SPName - 62.5 % ( 5/8) here what is 5/8 stands for ?
3. Though it is covered entire code still it shows SPName 50% (1/2) - not sure why it shows 50 %
4. is it possible to see the report in webpage or how can i store this coverage report
Appropriate your help !!
Thanks
Ed Elliott
February 4, 2016 - 12:29
Hi,
Hi,
Thank you!
5/8 is 5 statements out of the 8 that were found in the procedure.
If you are covering the whole proc but only reporting 50%, can you send me a sample so I can test it and see why it isn’t seeing it?
ed
Anonymous
February 4, 2016 - 12:41
ABC - 50% (1/2)
Well, here is my SP , for the below SP it shows ABC - 50% (1/2)
it is a single statement.
also “Display code coverage in document” says complete yellow.. bit wired ..
one more stuff noticed some other SP’s for the similar example it shows 75 % (1/2)
CREATE PROCEDURE ABC (@ID INT)
AS
BEGIN
SELECT Col1,Col2,Col3 FROM TABLE WHERE ID = @ID
END
Ed Elliott
February 4, 2016 - 12:57
The ScriptDom sees it as two
The ScriptDom sees it as two statements, the Begin/End and the Select but sql only executes the select - I had thought I had fixed this a while ago, i’ll make sure this is included in the next release :)
Anonymous
February 4, 2016 - 13:08
Thanks for the quick reply ..
Thanks for the quick reply .. any idea how do i store this results ? so that i can compare my previous and current coverage report.
Ed Elliott
February 15, 2016 - 15:39
Hi - I am looking at ways to
Hi - I am looking at ways to do this, one way is the visual studio .codecoverage files but they are in a propriety format and I think only visual studio enterprise, I will bear this in mind for later on
Ed Elliott
February 24, 2016 - 20:31
I fixed this a while ago, the
I fixed this a while ago, the latest build from https://github.com/GoEddie/SSDT-DevPack/blob/master/release/SSDTDevPack…. includes a fix so that it shows the number of statements correctly
Anonymous
February 25, 2016 - 11:51
Hi , i have installed new fix
Hi , i have installed new fix,but still it says 50 % only..
thanks
Ed Elliott
February 25, 2016 - 22:00
Hi - yes sorry I missed off
Hi - yes sorry I missed off the commit when I checked it in yesterday, this has it now:
https://github.com/GoEddie/SSDT-DevPack/blob/master/release/SSDTDevPack….
ed
Anonymous
February 26, 2016 - 12:50
Awesome.. it’s working
Awesome.. it’s working fantastic ..
Couple of inputs
1. Coverage color Green could be perfect match instead Red.
2. We need an option to export the coverage report to excel or some text file at least. (basic need - please address this in next build)
3. Slowness while using the utility entire VSTS slows down.
4. Is it possible to get the coverage with out using visual studio - it will help in production for sure.
Thanks In Advance
Ed Elliott
February 26, 2016 - 12:56
great!
great!
I am pulling out the code coverage into a separate project that will have a command line version (maybe a sqlclr version) so you can do it outside of visual studio - that will also have an export of some kind which I will back port to the dev pack.
The performance is quite slow as it has to keep re-parsing the dacpac’s and script files so at some point I will add some caching so only update things that have changed but that won’t be for a little while I think (unless it really starts to annoy me).
With the colour i’ll add a config option to help with that.
Thanks for using it, feel free to raise any issues on github which might be easier so things aren’t forgotten.
ed
Anonymous
February 26, 2016 - 13:15
Excited to see a command line
Excited to see a command line version
I am waiting …
Anonymous
February 26, 2016 - 13:08
Also , when are you going to
Also , when are you going to upload this latest fixes to https://visualstudiogallery.msdn.microsoft.com/ ?
Thanks
Ed Elliott
March 15, 2016 - 11:40
I’ve got some fixes I am
I’ve got some fixes I am working on for MergeUi so I will fix those before pushing to the gallery.
Anonymous
February 17, 2016 - 19:21
Hello! Visual Studio 2013
Hello! Visual Studio 2013 crashes when I click on any button other than Start Capture in Code Coverage. Help! Thanks.
Ed Elliott
February 24, 2016 - 20:31
Hi,
Hi,
Sorry about that, it is a personal pet hate of mine when extensions crash apps! I have added some error handling around those buttons, if you grab the latest build from https://github.com/GoEddie/SSDT-DevPack/blob/master/release/SSDTDevPack…. and then you should get an exception sent to the output pane, can you send it to me?
thanks,
ed
ashok
September 1, 2016 - 09:29
Its not working with AZURE
Its not working with AZURE SQL server instance. it throws exception while starting the trace
CodeCoverage, error starting the trace: System.Data.SqlClient.SqlException (0x80131904): Invalid object name ‘sys.server_event_sessions’.
Let me know if there is any solution to this.
Ed Elliott
September 14, 2016 - 07:18
Hi Ashok - yes you are
Hi Ashok - yes you are correct it used an older version of the code coverage that didn’t support Azure - if you use:
https://the.agilesql.club/blogs/Ed-Elliott/2016-04-08/SQLCover-Code-Cove…
Then you can cover azure but it isn’t built into SSDT - I will update it at some point to use the same version as SQLCover but it won’t be soon I am afraid.
ed
Luciano Evarist…
September 26, 2016 - 17:49
Not able to connect to localhost running SQL Server 2016
I am trying to connect it to localhost running SQL Server 2016, but it does not connect at all.
---------------------------
Error connecting: Erro de rede ou específico à instância ao estabelecer conexão com o SQL Server. O servidor não foi encontrado ou não estava acessível. Verifique se o nome da instância está correto e se o SQL Server está configurado para permitir conexões remotas. (provider: SQL Network Interfaces, error: 26 - Erro ao Localizar Servidor/Instância Especificada)
---------------------------
OK
---------------------------
Ed Elliott
September 27, 2016 - 19:16
It sounds like a standard sql
It sounds like a standard sql error - does the connection string work if you use it in a powershell script or .net app?
Deepak
February 10, 2017 - 21:38
Command utility to run against a SQL Instance
How can I run this through command utility or automatically using any tool?
Ed Elliott
March 28, 2017 - 15:31
Hey Deepak,
Hey Deepak,
See SQLCover - this is a version you can run using powershell so you can implement it in automated build:
https://github.com/GoEddie/SQLCover
prasanna
February 24, 2017 - 15:23
Code coverage result not displayed after clicking Stop Capture
Started to capture, entered db details and performed action on application using .exe application. After clicking Stop Capture the coverage screen displays blank page. It does not display as mentioned in this web page. Am i missing something
Ed Elliott
March 28, 2017 - 15:31
hmm sounds like something
hmm sounds like something went wrong - can you send me a sample project that reproduces it and i’ll test it?
