How do you debug your spark-dotnet app in visual studio?
When you run an application using spark-dotnet, to launch the application you need to use spark-submit to start a java virtual machine which starts the spark-dotnet driver which then runs your program so that leaves us a problem, how to write our programs in visual studio and press f5 to debug?
There are two approaches, one I have used for years with dotnet when I want to debug something that is challenging to get a debugger attached - think apps which spawn other processes and they fail in the startup routine. You can add a Debugger.Launch() to your program then when spark executes it, a prompt will be displayed and you can attach Visual Studio to your program. (as an aside I used to do this manually a lot by writing an __asm int 3 into an app to get it to break at an appropriate point, great memories but we don’t need to do that anymore luckily :).
The second approach is to start the spark-dotnet driver in debug mode which instead of launching your app, it starts and listens for incoming requests - you can then run your program as normal (f5), set a breakpoint and your breakpoint will be hit.
Changing your spark-submit command to:
spark-submit --class org.apache.spark.deploy.dotnet.DotnetRunner --master local microsoft-spark-2.4.x-0.4.0.jar debug
Then sit back and you should see something like this:
 https://the.agilesql.club/assets/images/spark/spark-dotnet-debug-mode.png
or:
spark-submit --class org.apache.spark.deploy.dotnet.DotnetRunner --master local microsoft-spark-2.4.x-0.4.0.jar debug
19/08/20 17:21:21 WARN NativeCodeLoader: Unable to load native-hadoop library for your platform... using builtin-java classes where applicable
19/08/20 17:21:22 INFO DotnetRunner: Starting DotnetBackend with .
19/08/20 17:21:23 INFO DotnetRunner: Port number used by DotnetBackend is 5567
***********************************************************************
* .NET Backend running debug mode. Press enter to exit *
***********************************************************************
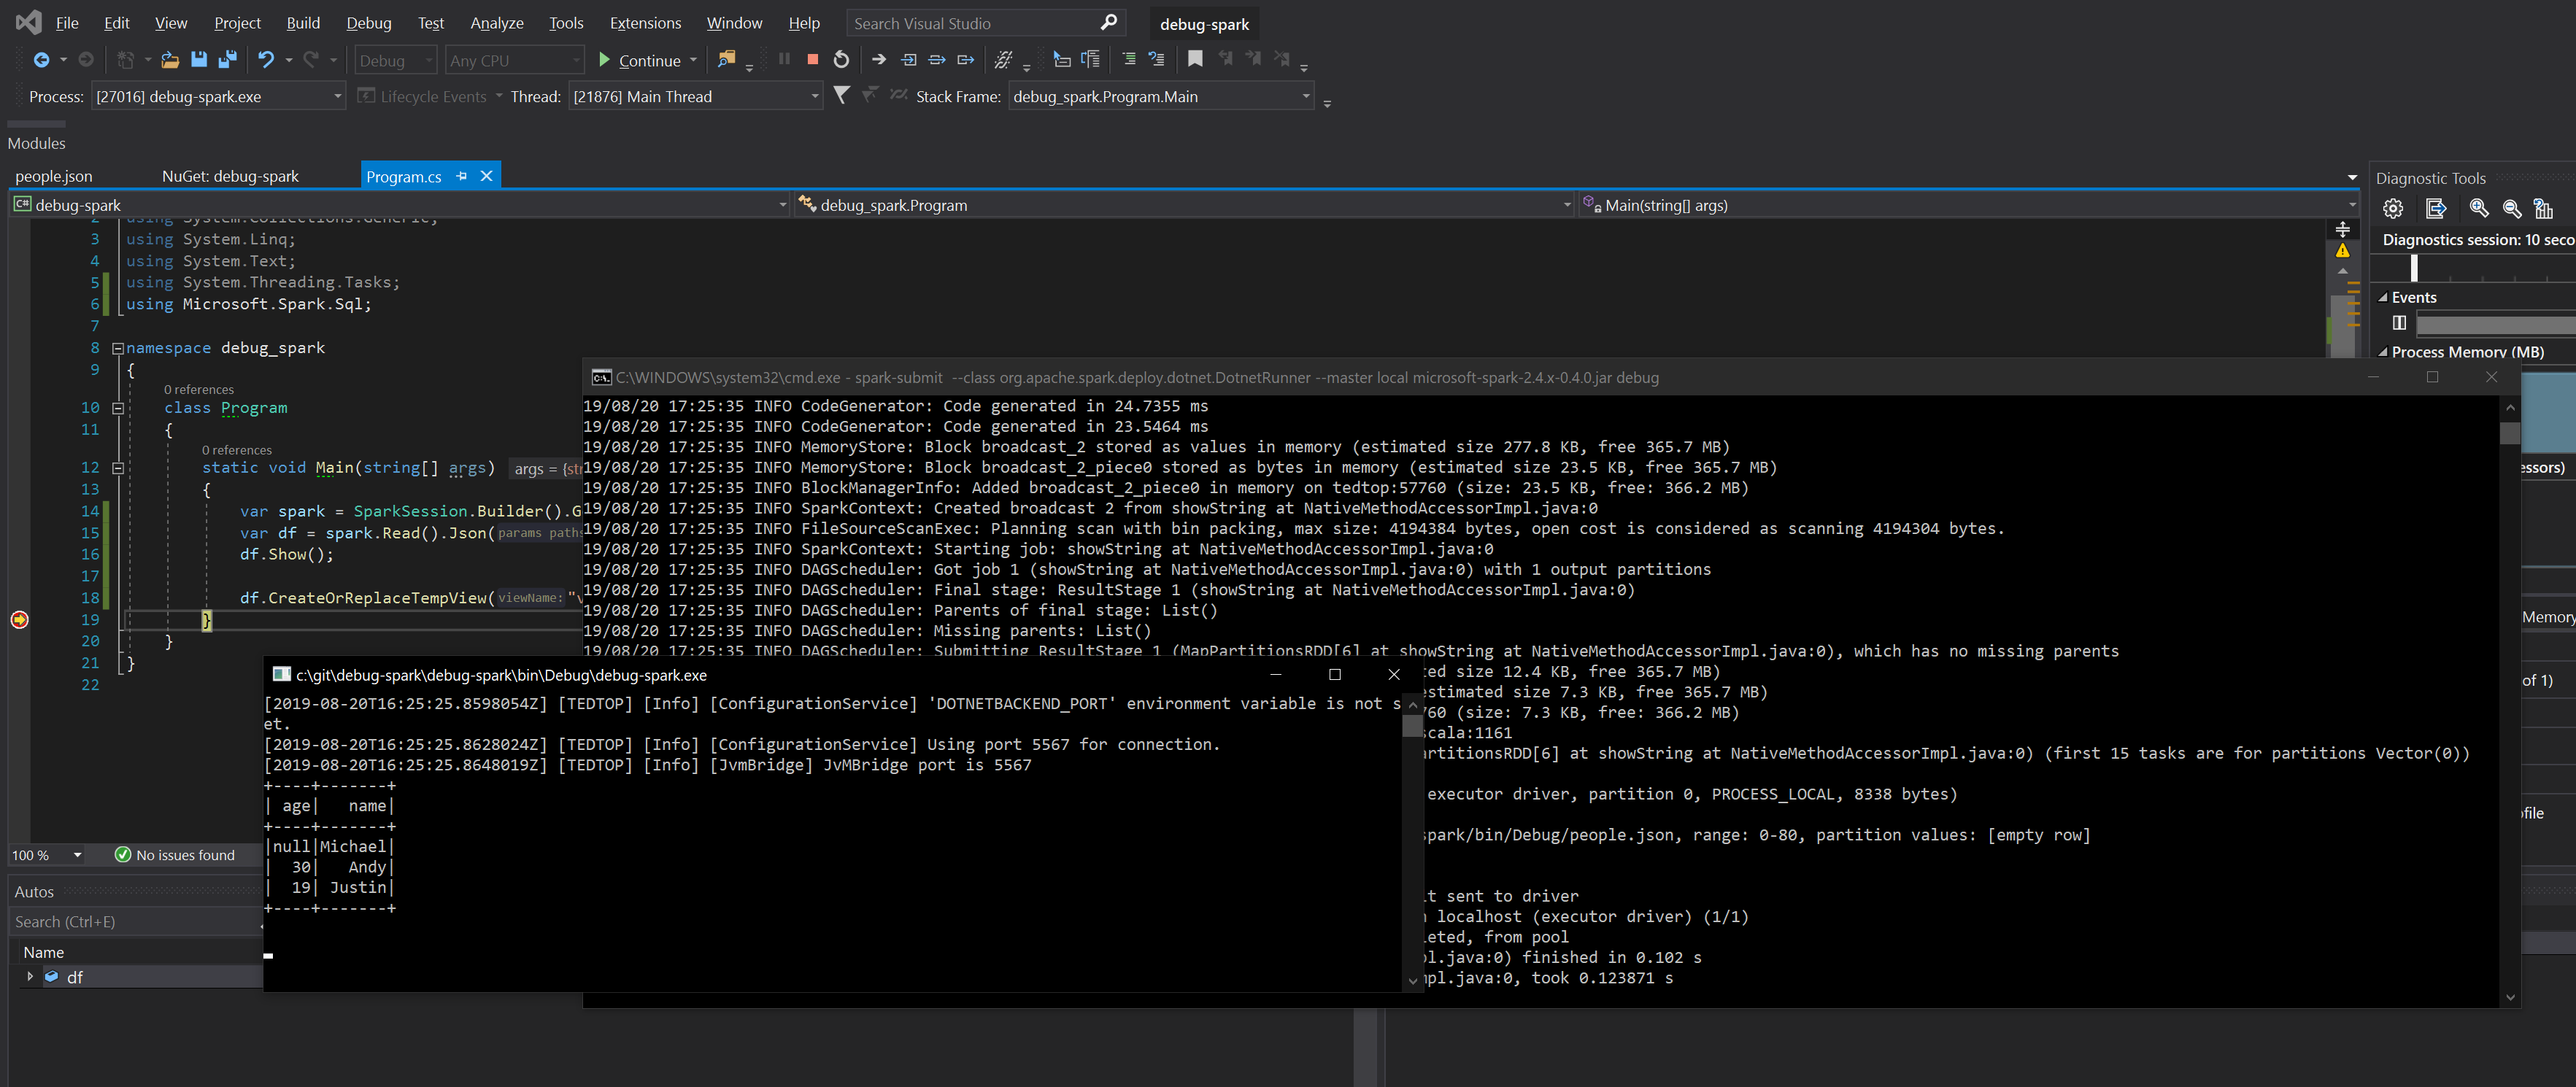
Then you can press F5 in Visual Studio and you’ll end up with the console output from spark, the console output from your app (assuming it is a console app!) and the visual studio debugger which has everything like breakpoints, watches, etc:
 https://the.agilesql.club/assets/images/spark/debug-f5.png
Now, I didn’t tell you but it gets even more exciting - once you kill your app you can execute more apps against the same spark instance so you no longer have to create a new spark instance everytime you want to run an app - wowsers, just think how much faster that will make your integration tests :)
