ADF: Error trying to debug pipeline: BadRequest
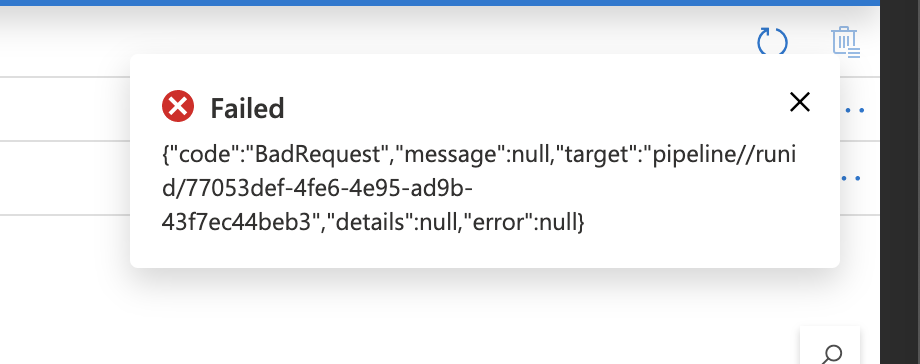
I made a mistake recently when I was creating an ADF pipeline, annoyingly I made loads of changes and then clicked the debug button, when I pressed debug the pipeline failed to start and I was presented with this little beaut of an error message:

The pipeline was quite complicated and so I didn’t know exactly what was causing it so I went through the usual ADF troubleshooting steps (save all then refesh the web page) that didn’t help. The thought of doing the “binary chop” on my pipeline was not fun especially as I use a macbook and ctrl+z doesn’t undo (nor does cmd+z) annoyingly.
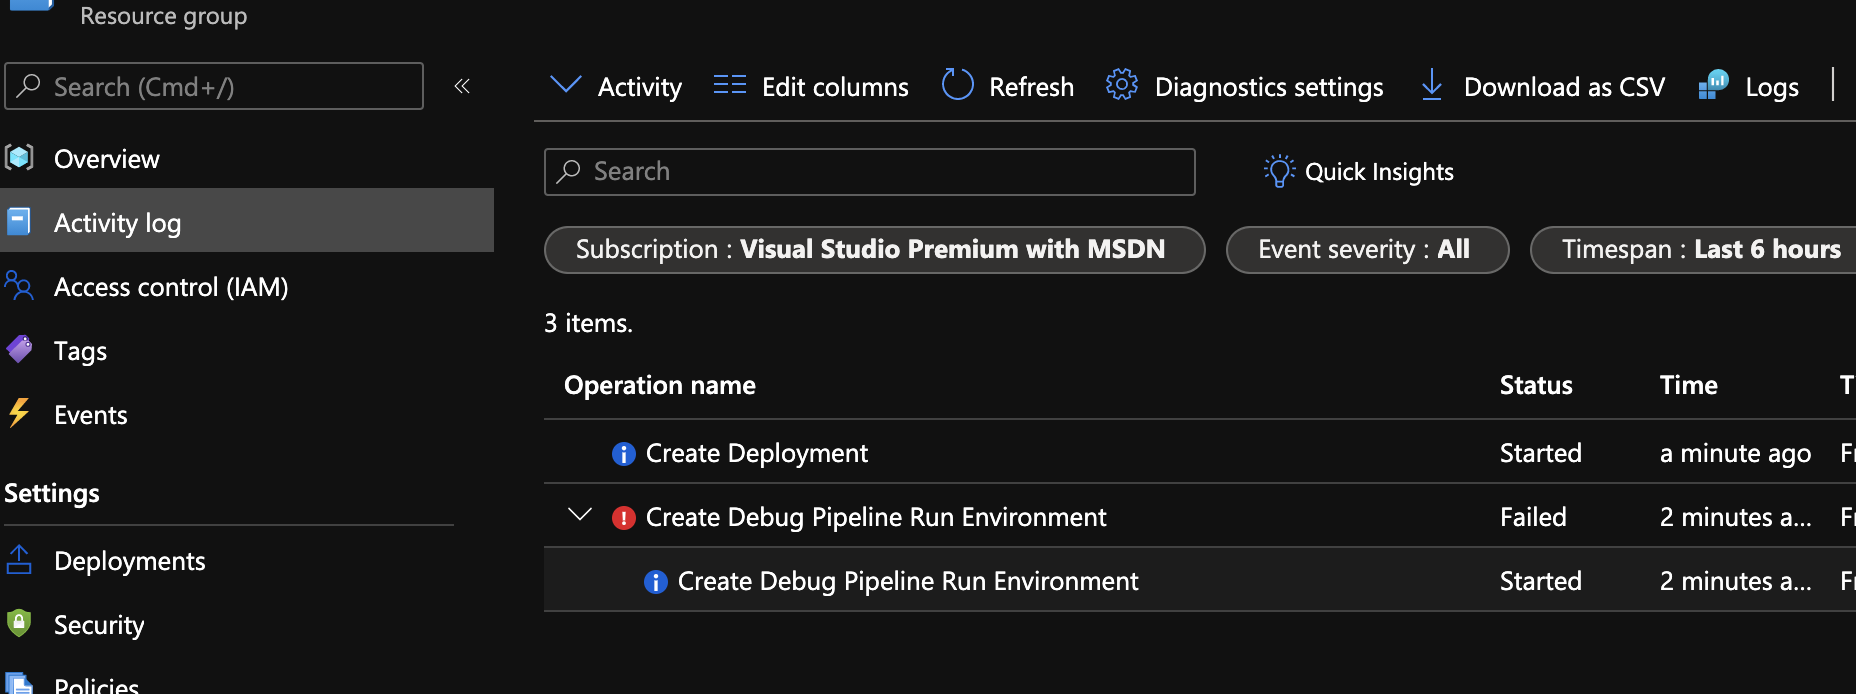
So, what to do? Well I don’t know if you know much about ADF is implemented, I don’t, I would like to know more but the ADF service is private to Microsoft but one thing I do know is that when you debug the pipeline it is published to a sandbox and executed there. The publishing to the sandbox uses a private Azure ARM API, I know this because if you get a failure like this then in the portal you can see the activity logs:

Now, whenever I am troublehooting something in Azure and I come to the activity logs I am always hopeful but also always dissapointed that they don’t show more details. The bit that really annoys me is that I know Micrsoft see more detailed error information as I have been screen sharing with a support tech who used log exporer to see more detailed error messages than I see - grrrr, just show us the data! Anyway, I digress - so in the activity log, does it give a clue as to what is wrong?
No, in a word no it doesn’t. The most exciting part was this blob of JSON which shows the same error details we already know about:
"properties": {
   "statusCode": "BadRequest",
   "serviceRequestId": null,
   "statusMessage":
      "{\"code\":\"BadRequest\",\"message\":null,\"target\":\"pipeline//runid/1118c81b-045a-4ff7-93ba-a9f74753fc41\",\"details\":null,\"error\":null}",
   "eventCategory": "Administrative",
   "entity": "/subscriptions/BLAH/resourcegroups/syn-app/providers/Microsoft.DataFactory/factories/dklsjalkajdakldj/pipelines/Broken/sandbox/create",
   "message": "Microsoft.DataFactory/factories/pipelines/sandbox/action",
   "hierarchy": "6cfbb0af-d872-47ab-8368-dbef1d2cf61c"
    },
So, same thing BadRequest but not much more. Hmmm, interesting so what next? Well we know an API is being called and we are getting an error BadRequest and in the activity log we can see it is actually an HTTP 400:
"status": {
        "value": "Failed",
        "localizedValue": "Failed"
    },
    "subStatus": {
        "value": "BadRequest",
        "localizedValue": "Bad Request (HTTP Status Code: 400)"
    }
So we know that the contents of the pipeline are sent to an API which deploys to a sandbox - maybe if it is a problem with the deployment itself so lets try publishing the pipeline and maybe we will get a better error message? No dice, pipeline publishes without error. Next I thought that I wanted to try and see the contents of the API request, maybe something was going screwey with the JSON. What if, just what if the web browser sends the request to the API rather than the web browser sending a request to an ADF service which created and sent a request to the management API? That would be exciting!
So, next step over to chrome dev tools and use the network tab to see if we can capture the request and bingo, a POST to management.azure.com with the 400 BadRequest:

At the bottom it has the JSON body which is the most likely place for there to be an error but the JSON looks cushty, hmmm.
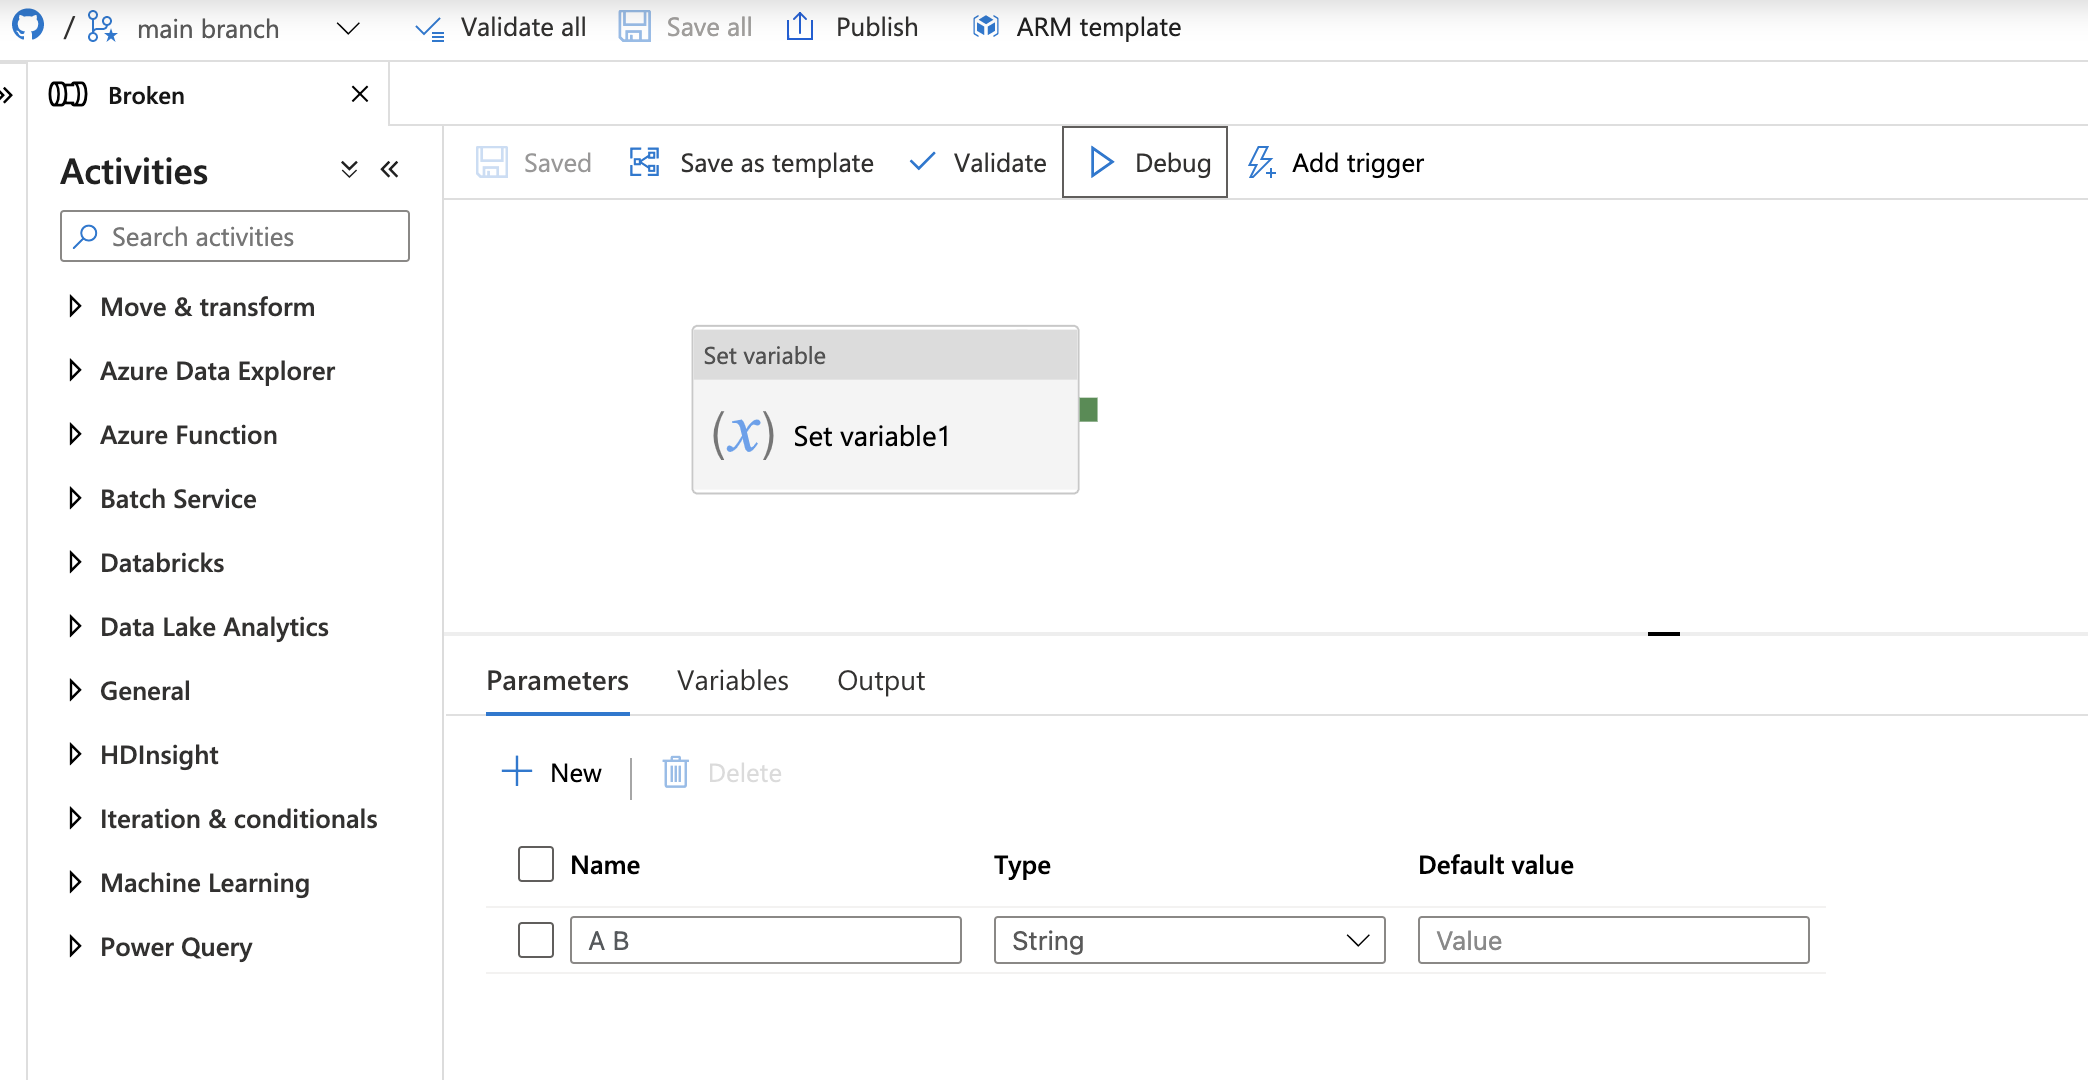
So I don’t think there is anymore self-help type troubleshooting I can do so I went for the binary chop and I found the error, can you see the bug in this image?

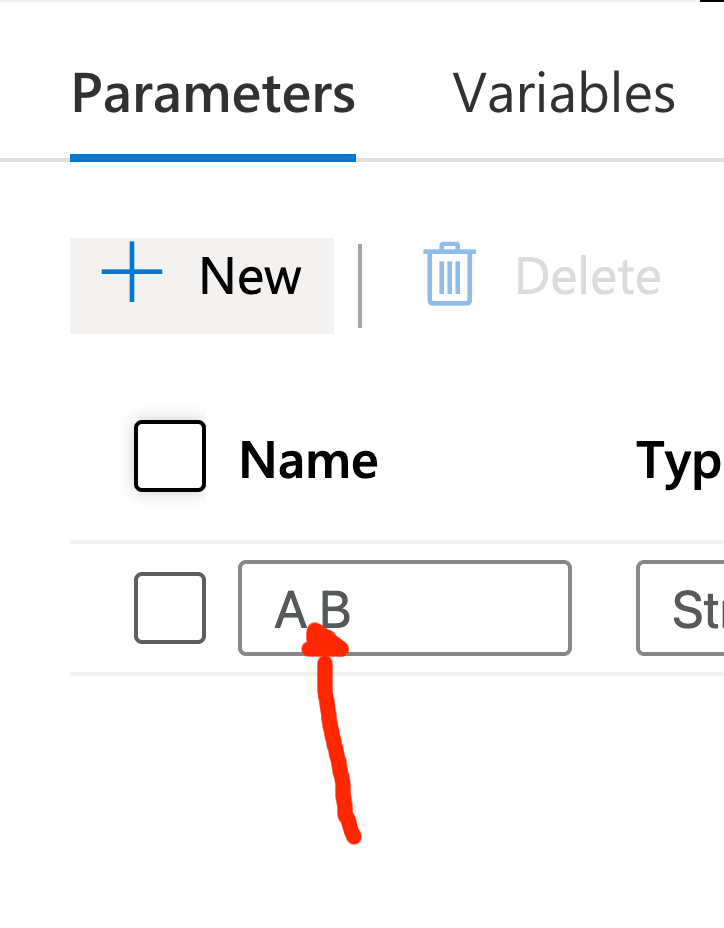
Yes, you got it! I killed ADF using a space in the name of the parameter:

So there you have it, a space in the parameter name causes the sandbox API call to fail with BadRequest, lovely.
